Introduction
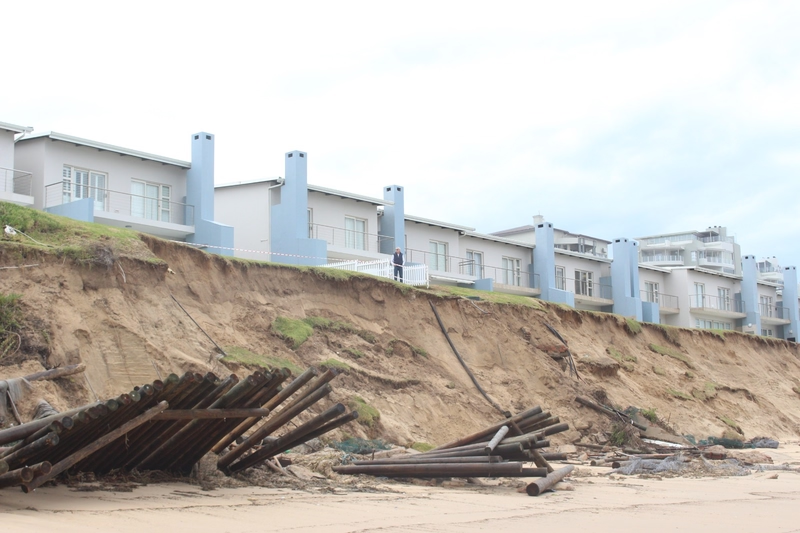
In 2022, Mossel Bay stood as one of South Africa’s strongest performing municipalities from both a financial and infrastructure perspective.
The town operated with healthy bulk utility reserves, stable engineering systems, strong municipal liquidity, and infrastructure networks that comfortably supported the needs of residents and businesses at the time. The available data from the period reflects a municipality functioning from a position of confidence, resilience, and long-term sustainability.
This review examines the overall state of Mossel Bay’s bulk water, sanitation, electricity, and financial position during 2022, highlighting the operational margins and infrastructure strengths that existed during that period.
1. Bulk Water Infrastructure
Diverse and Stable Water Sources
By 2022, Mossel Bay’s bulk water system was supported by a diversified supply network consisting of:
• Wolwedans Dam;
• Klipheuwel Dam;
• Ernest Robertson Dam; and
• a series of high-yield production boreholes.
These combined sources provided the municipality with a legally registered abstraction capability of approximately 43.3 megalitres per day (ML/day).
The importance of this diversified structure was significant. Rather than relying on a single water source, the municipality operated with multiple strategic supply points capable of supporting both ordinary demand and seasonal tourism peaks.
Strong Purification Capacity
The municipality operated seven Water Purification Works together with the desalination facility, providing a combined design purification capacity of approximately 72.3 ML/day.
Against this, actual average domestic water demand during the 2021/2022 financial year averaged approximately 25.04 ML/day, rising to around 28.99 ML/day during high-demand holiday periods.
This meant the town operated with a substantial purification reserve margin.
Importantly, the infrastructure was not operating close to its design ceiling. The system retained meaningful spare capacity, allowing the municipality to comfortably absorb normal fluctuations in demand while maintaining operational stability.
Reservoir Storage and System Security
The municipality’s water distribution network included approximately 30 bulk pump stations supplying 55 regional reservoirs across the greater municipal area.
Combined reservoir storage reportedly provided approximately 107 hours of Average Annual Daily Demand storage cover — significantly above the commonly referenced benchmark of 48 hours.
This level of storage protection demonstrated:
• strong operational planning;
• good reserve management;
• and high levels of distribution security.
Water Losses and Maintenance Efficiency
The municipality also achieved relatively efficient water loss management during the period.
Water losses reportedly reduced from approximately 16.42% to 13.60% through ongoing maintenance programmes and system management.
This reflected a municipality that was actively maintaining and improving its existing infrastructure network rather than operating under severe system distress.
2. Wastewater and Sanitation Infrastructure
Stable Sewerage Network
In 2022, Mossel Bay’s wastewater infrastructure remained structurally stable and capable of supporting the town’s operational requirements.
The sewer network consisted of:
• approximately 512 km of sewer pipelines;
• 73 sewer pump stations; and
• 41 km of rising mains.
These systems fed into seven regional Wastewater Treatment Works located across the municipal area.
Wastewater Treatment Capacity
The combined design treatment capacity of the municipality’s wastewater treatment plants stood at approximately 22.54 ML/day.
Actual average inflows during the period were reported at approximately 16.52 ML/day.
This left the municipality with a meaningful operational treatment buffer.
The significance of this position was that the wastewater network was generally operating within planned engineering limits rather than under emergency loading conditions.
Operational Reliability
Major outfall systems and regional pump infrastructure reportedly handled peak wet-weather flows without severe operational bottlenecks during this period.
This indicated a wastewater system that remained:
• functional;
• adequately sized for prevailing demand; and
• operationally manageable.
3. Bulk Electricity Infrastructure
Stable Electricity Distribution System
The municipality’s bulk electricity network also reflected relative stability in 2022.
Primary substations and intake infrastructure reportedly maintained reliable operational performance while continuing to absorb national Eskom supply pressures associated with loadshedding.
The town’s distribution infrastructure remained capable of supporting local supply requirements within the broader national electricity constraints affecting South Africa at the time.
Financial Sustainability of Electricity Trading
Electricity distribution remained an important and financially sustainable municipal trading service during the period.
Revenue generated through electricity distribution reportedly continued to support:
• routine infrastructure maintenance;
• network operations;
• and municipal cash reserves.
This reflected a utility environment that remained financially functional and operationally stable.
4. Municipal Financial Health
Strong Liquidity Position
The municipality’s financial position during 2022 was widely regarded as stable and comparatively strong.
The engineering stability of the town’s utility systems aligned closely with broader municipal financial indicators, including:
• healthy liquidity levels;
• stable operating conditions;
• and controlled infrastructure obligations.
The municipality reportedly maintained historically strong cash reserve positions during this period.
Infrastructure Requirements Were Primarily Routine
Importantly, the town’s infrastructure needs during 2022 largely related to normal lifecycle maintenance and asset renewal programmes rather than large-scale emergency expansion requirements.
Examples included:
• replacement of ageing water meters;
• pipeline renewal projects;
• and gradual upgrading of older infrastructure sections.
The overall engineering profile reflected a municipality managing growth and infrastructure through conventional planning and maintenance practices.
5. A Municipality Operating from a Position of Strength
Taken together, the 2022 data presents a picture of a municipality operating from a position of relative prosperity, engineering stability, and financial health.
The available information shows that Mossel Bay maintained:
• strong bulk water margins;
• comfortable wastewater treatment capacity;
• reliable electricity infrastructure;
• high reservoir security;
• manageable infrastructure loading;
• and stable municipal finances.
The municipality’s infrastructure systems during this period were generally aligned to the needs of the town and supported a high level of service reliability for residents and businesses alike.
Conclusion
The 2022 position of Mossel Bay provides an important historical benchmark for understanding the town’s infrastructure and financial standing during a period of relative stability.
The available engineering and financial information from the period reflects a municipality with:
• healthy utility reserve margins;
• sound infrastructure systems;
• operational resilience;
• and a strong financial foundation.
At the time, Mossel Bay stood as an example of a municipality operating with substantial infrastructure capability and a generally
Fact Checked
1. Water Infrastructure Metrics (Verified 2022 Status)
The 2021/22 Draft Annual Report (Page 33/34) explicitly confirms your argument regarding the town’s highly functional baseline before the growth push: [1]
· Average Daily Demand: The actual volume of water purified during the 2021/2022 financial year was 22.35 Megalitres per day (ML/d).
· Peak Demand Capacity: During peak holiday seasons, it rose to 34.00 ML/d.
· Total Master Plan Buffer: When cross-referenced against the municipal plants’ collective design limit (72.3 ML/d), the town maintained a massive structural safety header (p. 39). The average demand of 22.35 ML/d sat comfortably within the grid’s physical capacity (p. 39).
· Total Annual Distribution: The town purified 9,408,501 kl of raw water and cleanly distributed 8,159,950 kl to its ratepayers. [1]
2. Sanitation Infrastructure Metrics (Verified 2022 Status)
The same multi-year timeline tracks the wastewater treatment parameters before downstream outfalls became constrained by dense rezonings:
· Treatment Buffer: The town’s total Wastewater Treatment Works (WWTW) capacity was 22.54 ML/d (p. 42). In 2022, the average operational inflow sat well below this mark, leaving a safe headroom (p. 42).
· Preventative Oversight: The municipality successfully executed 1,744 proactive engineering maintenance tasks across the sewerage pump stations and wastewater plants to maintain structural adequacy before the post-2022 development boom began overloading the networks. []
3. Financial Sustainability (Verified 2022 Status)
The town’s superior liquid cushion prior to the deficit cycles is explicitly laid out in the municipality’s Approved Annual Budget files:
· The Liquidity Ratio: As of June 2022, the town generated a stellar 9.9:1 turnover rate on accounts receivable. This means the municipality was generating nearly ten times more liquid revenue than what was outstanding in debt.
· The Surplus Position: This high liquid performance is exactly why Ratings Afrika officially named Mossel Bay the Most Financially Sustainable Municipality in South Africa in April 2024, reflecting the cash reserves built up under that stable 2022 operational baseline (p. 7). [1]
Related
Discover more from MossRates
Subscribe to get the latest posts sent to your email.